Long-Term Care Specific
This section of the learning center contains items that are specific to Long-Term Care clients.
Monthly Census and PPD Summary
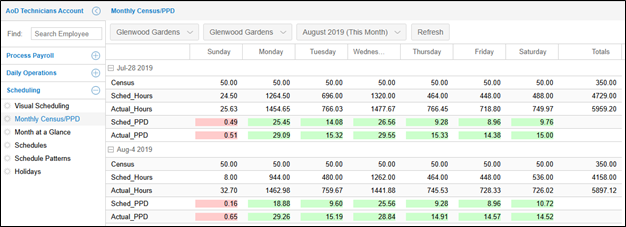
The monthly census (official count of population) and PPD (Per Patient Day) provides a quick summarized view of the progress toward mandated and organizational staffing metrics, along with threshold colors to clearly identify prioritized data, such as insufficient and more than sufficient coverage.
Expand the section below to see step-by-step guide
This view will display the coverage types that have been configured in your system. The most common data LTC clients request include:
• Census
• Scheduled PPD
• Actual PPD
• Scheduled Hours
• Actual Hours
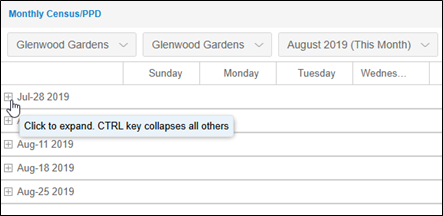
Click the + icon to expand the display of census, hours and PPD data for the week selected.
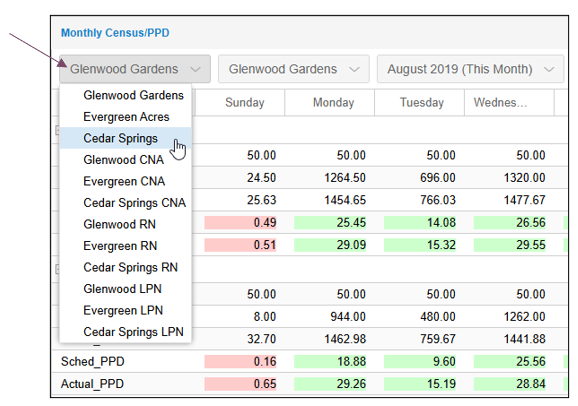
Use the drop-down list to change the workgroup displayed, if you have multiple locations and positions for those locations.
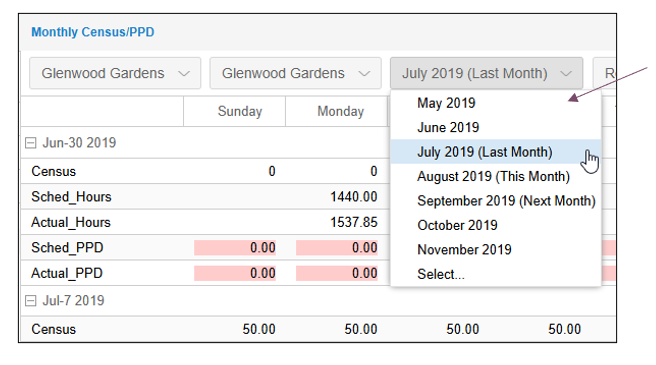
Adjust the period you want to view census and PPD data using the date drop-down list.
Updating a Census Value
Coverage calculation data is updated as schedule changes occur. Updates will also occur when manually entered values, such as census numbers are modified. The census for LTC (Long Term Care) clients typically remains static but can occasionally fluctuate.
Expand the section below to see step-by-step guide
To update a census value, click the day in the Census row of the report and type the new number in the cell. Click the Refresh button after entering the update to refresh the system to populate the new value in Visual Scheduling.
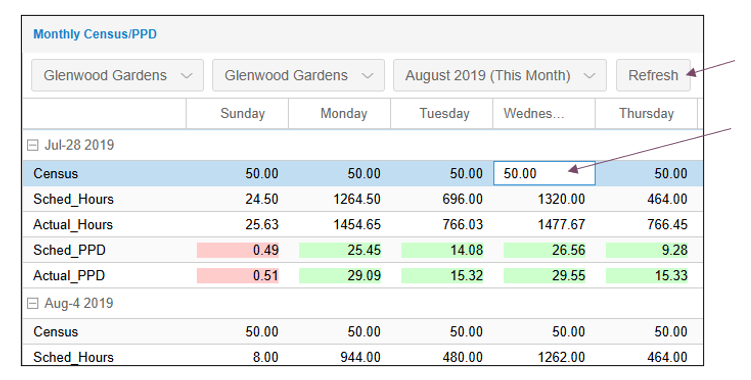
The updated census will be displayed in the coverage budget data displayed in the schedule template.

To view coverage budget data in the schedule template, click the Operations drop-down list and select My Preferences. Enable the Show Coverage Budget Data check box.
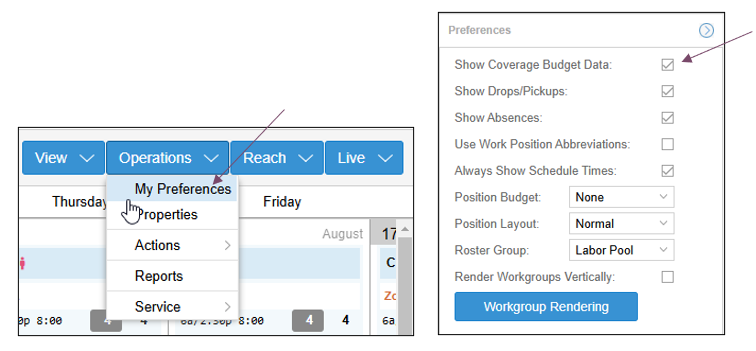
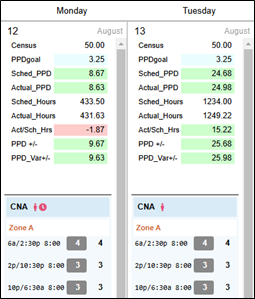
Coverage budget data, including census information, is displayed each day above the coverage schedules in the template.
Download the PDF job aid here –> Monthly Census and PPD Summary Job Aid.
Hours Reporting
Summary sheets displaying the number of hours worked per position, location, department, zone, workgroup, etc. are useful resources for LTC administrators and managers. These summaries provide real-time data that is needed in order to plan budgets.
Summary sheets reporting hours can be accessed at any time from menu items in Attendance on Demand. Menu items are typically configured for each workgroup level. 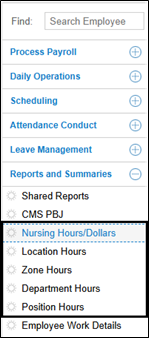
Expand the section below to learn more about Hours Reporting
Position hours summary sheets can be configured to display specific groups of employees, such as employees who work in nursing positions, with their position, hours and dollars per pay designation and total worked hours and dollars.

Total worked hours and dollars can be viewed by scrolling to the right side of the report.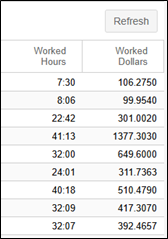
Columns in the sheets can be sorted in ascending and descending order and grouped according to type by clicking the header of the columns. 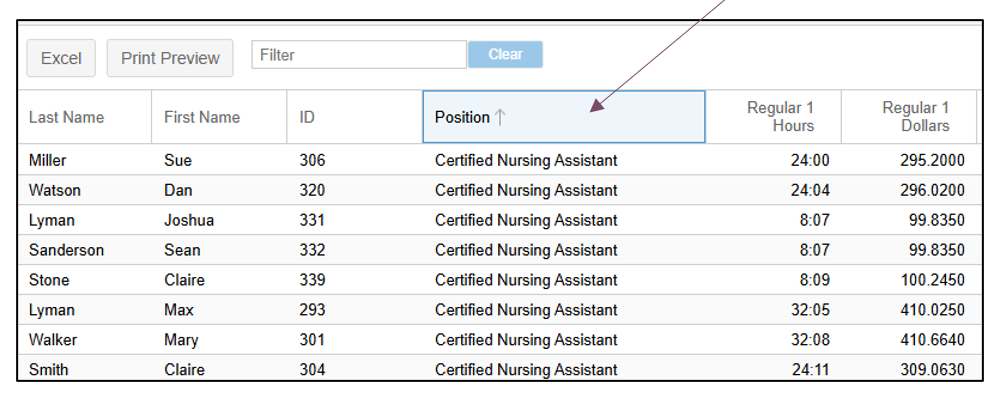
Type all or part of a position name in the Filter field and hit the Enter key on your keyboard to view all employees working that position to the top of the report.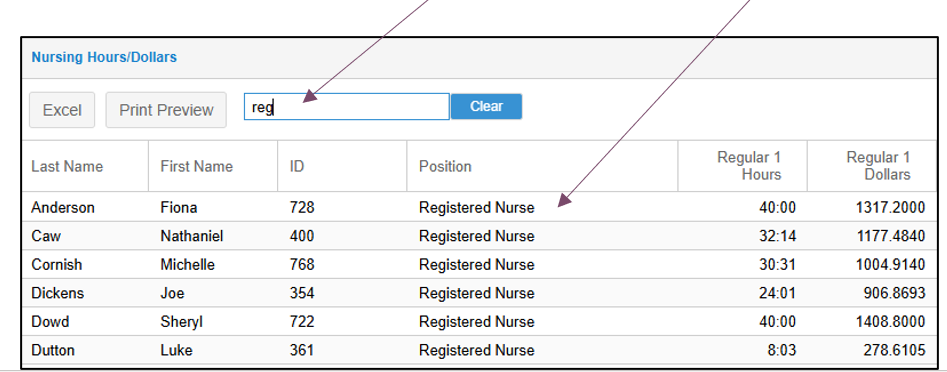
Click an employee name to drill down to the employee’s time card page. Print or export reports to an Excel spreadsheet using the Print Preview button and Excel button. 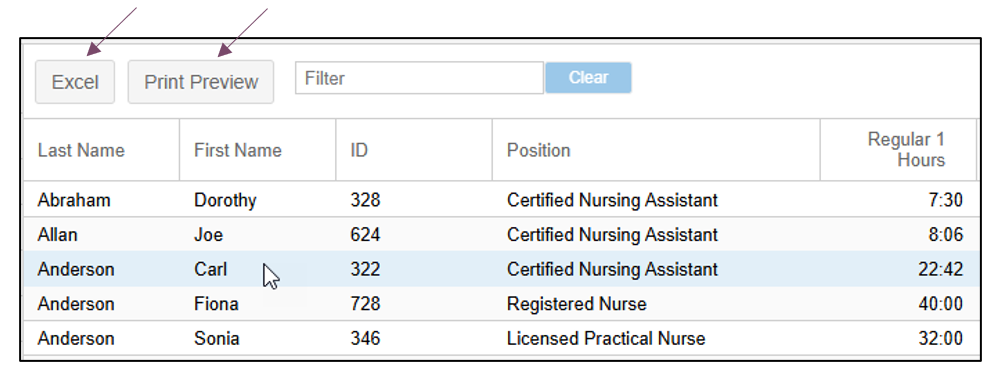
Printed reports will appear on screen in as a PDF. 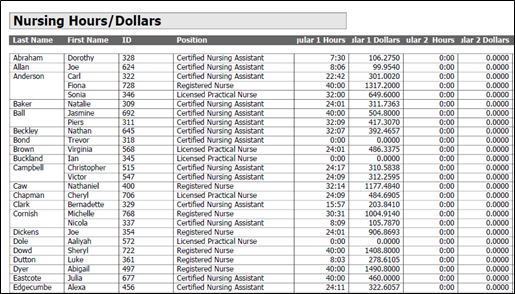
Summary sheet listing location, department, zone, etc. hours can be filtered according to the selections made from the Period and Pay Period Class drop-down lists. 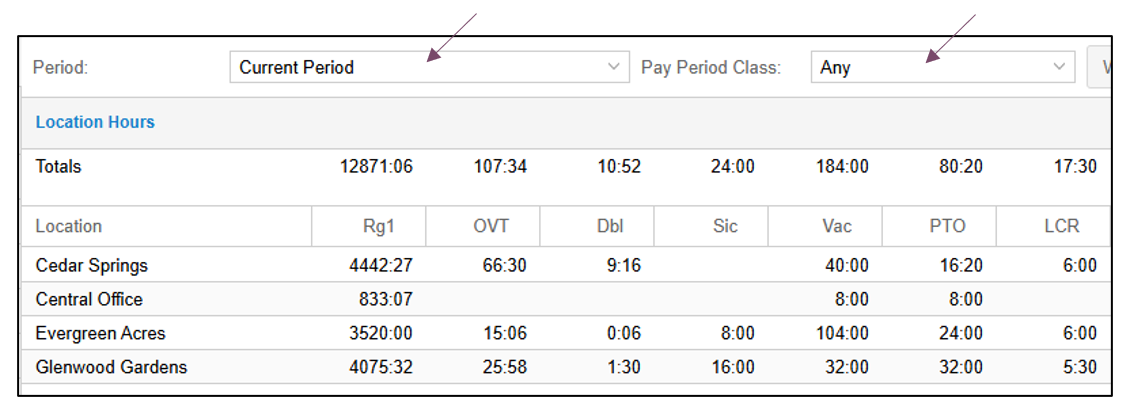
Download the PDF job aid here –> Hours Reporting Job Aid.
Daily Assignments Report
One common requirement of state reporting for Long Term Care (LTC) facilities is to post a report at the beginning of each shift that contains the census and schedule summary for each employee by position, per shift. It must be accessible by both employees and patients. This report mandated by the Medicare, Medicaid, and SCHIP Benefits Improvement and Protection Act is referred to as the BIPA report.
Another common term for this report is a Clipboard report. This name is used because supervisors also print and carry the reports around to confirm that employees are on the job and in the right locations, then check them off the report. The Daily Assignments Report accessed within the schedule template in Attendance on Demand meets the BIPA requirements.
Expand the section below to learn more about Daily Assignments Report.
To view the report, click a date within the template and select Daily AssignmentsReport. 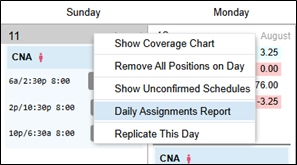
The report is displayed in the Reports panel that expands below the schedule template. The report format meets the state requirements by indicating census totals and the number of employees for each position per shift.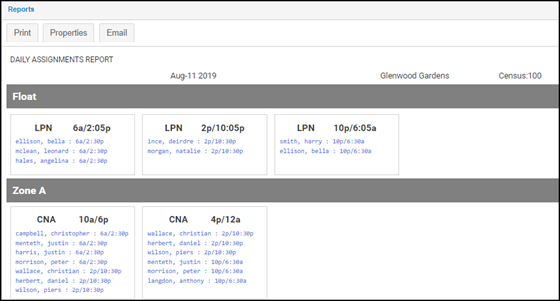
FTE (Full Time Equivalent) and Census (official population count) information required per position is displayed at the end of the report. 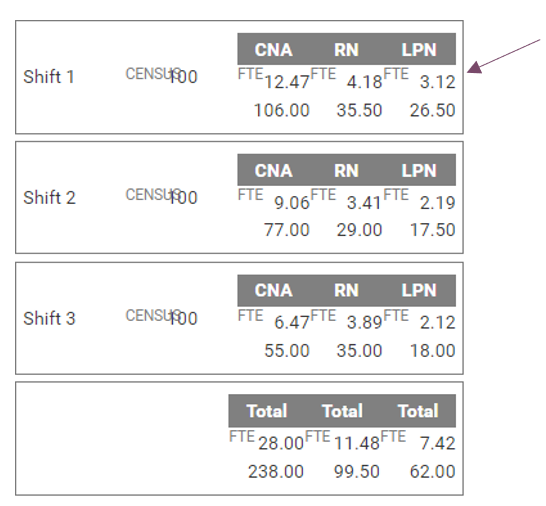
If you do not see census or FTE data displayed in your report, click the Properties button in the Reports panel to adjust how information is displayed in the report. 
Enable the FTE/Hours Assigned Schedules Only check box to display FTE data in your report. Select Census from the Census Coverage Type drop-down list to allow census totals to display in the report. 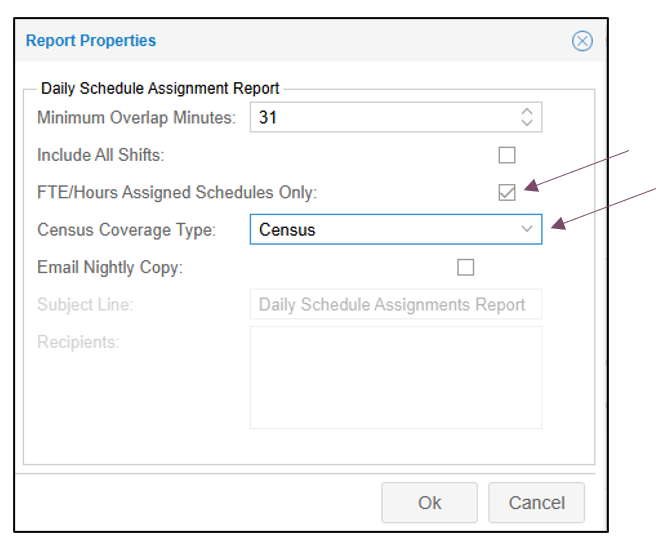
Additional report properties that can be adjusted include:
Minimum Overlap Minutes - The Minimum Overlap Minutes setting prevents employees from appearing in two consecutive shifts in the report when they are scheduled for one shift that overlaps a portion of the next shift. For example, if there is a schedule that overlaps another schedule by 30 minutes, the minimum for overlap should be set at 31 minutes to prevent employees in the overlapping shift from showing up in both shifts in the report.
Include all shifts – If enabled, this will include shifts where no one is scheduled in the report.
Email Nightly Copy – If enabled, the system will automatically send a nightly copy of the report to the selected recipients.
If zone scheduling is used, the zones will be listed separately in the report. 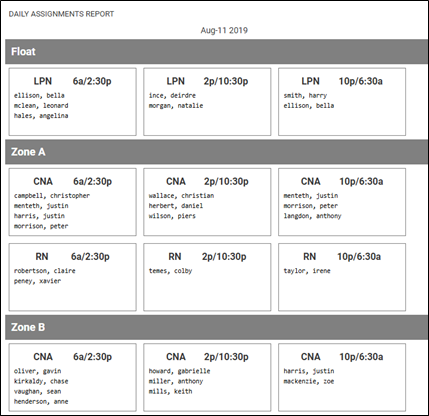
When coverage schedules match the shifts on the Schedule Labels tab for the specific work position, the work position and assigned employees are surrounded by a box in the report. Coverage schedules not matching schedule labels are displayed without a box.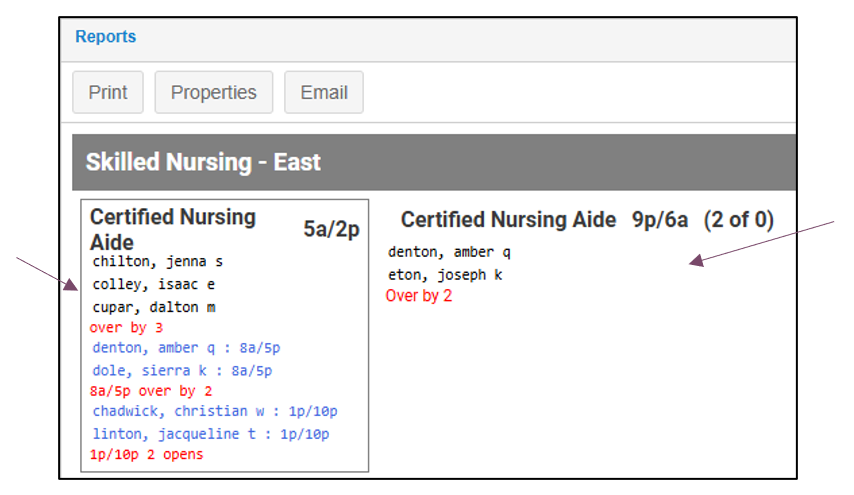
To add schedule labels, click the work position banner in the schedule template and select Work Position Properties.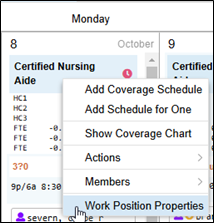
Click the Schedule Labels tab and the Add button. In the following example, a shift with start time 5:00a and end time 2:00p is created on the Schedule Labels tab for work position CNA. 
Schedule labels appear in place of the schedule times in the template.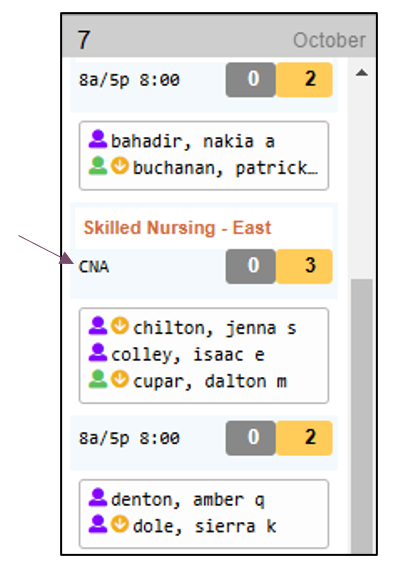
The daily assignments report shows who is scheduled for the day, listed by work position. It will also show where there are open shifts for the day and where there are over scheduled and under scheduled work positions. Within each shift cell of the report the employees listed in black text have scheduled shifts that correspond with the position shift time. 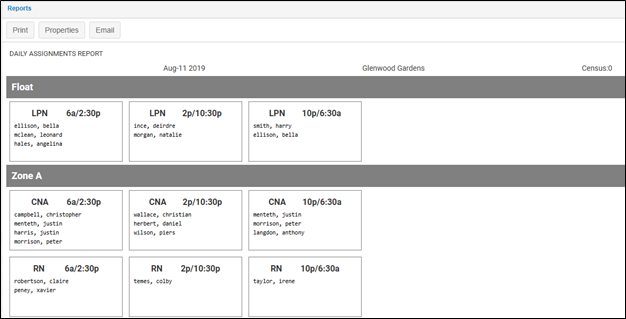
Overscheduled shifts in the report are indicated by red text indicating how many employees are overscheduled. Schedules that require additional employee are also indicated by red text indicating the number of opens. 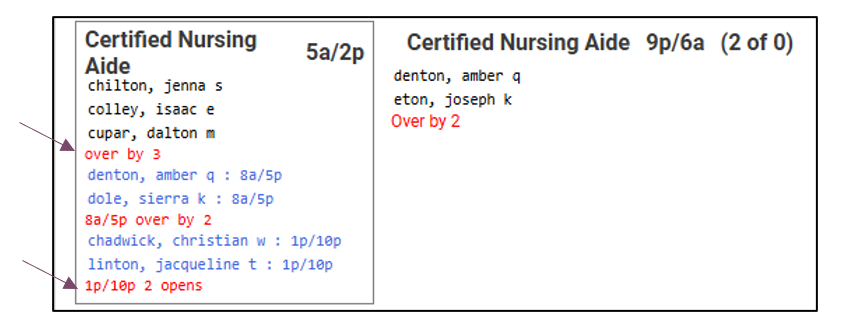
If the open schedule overlaps the current schedule, the schedule time and over by the number is listed in red text. When employees schedules overlap or fall within the position shift time, but don’t exactly match that time, then they are listed with blue text. 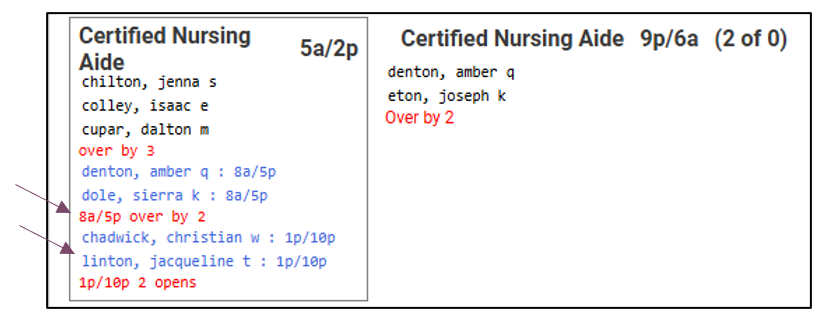
Download the PDF job aid here –> Daily Assignments Report Job Aid.